Lamps
Breakdown of collection by source
The graph shows the breakdown of tubes and lamps collected per source.
Click on the + to discover the chart.
Progression in collection per lamp type
The graph shows the breakdown of tubes and lamps collected per source.
Click on the + to discover the chart.
Autres lampes: other lamps
A incandescence: Incandescence bulbs
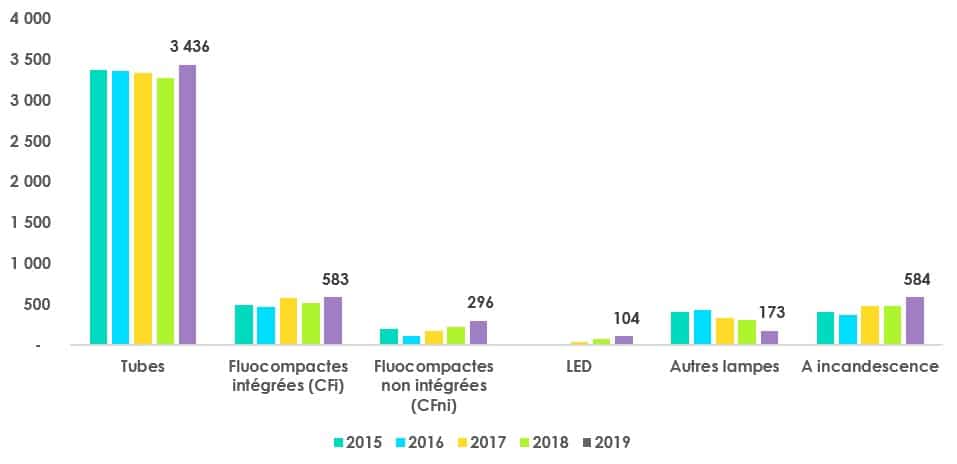
Progression in collection
2019 was in fact a record year with the collection of lamps that clearly achieved the symbolic milestone of 5,000 tonnes.
Click on the + to discover the chart.
Local authorities
Local authorities collected 1,406 tonnes of lamps from their 2700 collection points in operation.
Retailers
General public and professional retailers collected 2,301 tonnes of lamps from their 12,176 collection points.
Other channels
Other channels (those with WEEE, waste management operators and fitters) collected 1,737 tonnes of lamps from their 2,839 collection points.


